Results and Discussion

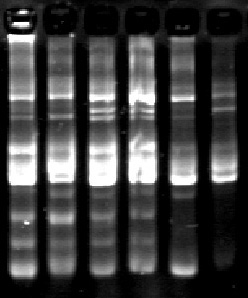
 Agarose gels of the PCR results

On the gel, if the bands were common by all members they were considered monomorphic. If the bands were not common to all members, then they were polymorphic meaning that there was genetic variation in the skunk cabbage.

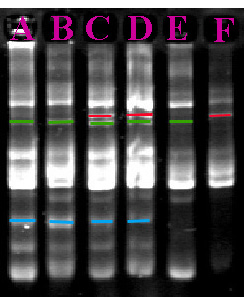
Not all of the bands came out clear in every lane, so we focused on scoring 6 lanes (or individuals) and 3 different bands. If the lane had the band it was scored 1. If it did not contain the band it was scored 0. We did this for all three bands in all six lanes.

We then compared the lanes to each other to see if any contained the same bands. A matrix was set up to compare which lanes (individuals) were similar. This equation was used to find the percent of similarity between two individuals: # markers same/# total markers = % similarity between two individuals.

Agarose Gel

Polymorphic bands colorized


Individual A - site 2 (green dot on map)

Individual B - site 2

Individual C - site 3 (red dot on map)

Individual D - site 3

Individual E - site 3

Individual F - site 4 (purple dot on map)


A

B

C

D

E

F

Analysis of Similarity

Individuals A-F were scored as to whether they contained the bands A (red), B (green) or C (blue), bands that showed polymorphism. A comparison was made between individuals A compared to B, A compared to C, etc to achieve a % similarity (see % similarity matrix at left). The table at right shows the similarity achieved with three markers. For example, individuals A and B were identical to each other and individuals C and D were identical to each other. Individuals A and B were both from site 2. Individuals C and D (both from site 3) were only 33% similar with individual E, which was also from site 3.


A

1.0

1.0

.66

.66

.66

0

B

1.0

.66

.66

.66

0

C

1.0

1.0

.33

.33

D

1.0

.33

.33

E

1.0

.33

F

1.0


Objectives

Facts about Skunk cabbage

Introduction

Materials and Methods

Results and Discussion

Conclusion