SPSS On-Line Training Workshop |
 |
|
SPSS On-Line Training Workshop |
|
|
 In this Tutorial:
|
Legacy Dialogs graphs can be obtained by clicking on “Graphs” menu and selecting “Legacy Dialogs” and then selecting the type of desired graph. To create a Pie Chart, select “Pie…” after selecting “Legacy Dialogs”. This is illustrated by using the Math Assessment data set.
|
Creating a Legacy Pie Chart
|
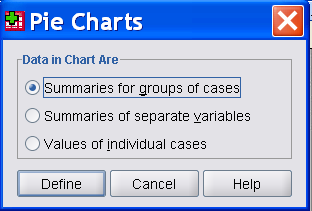
After you choose “Graphs”, “Legacy Dialogs” and then “Pie” from the menu, the following box will appear.
You must select how your data is grouped and then press "define" to get the next dialog box:
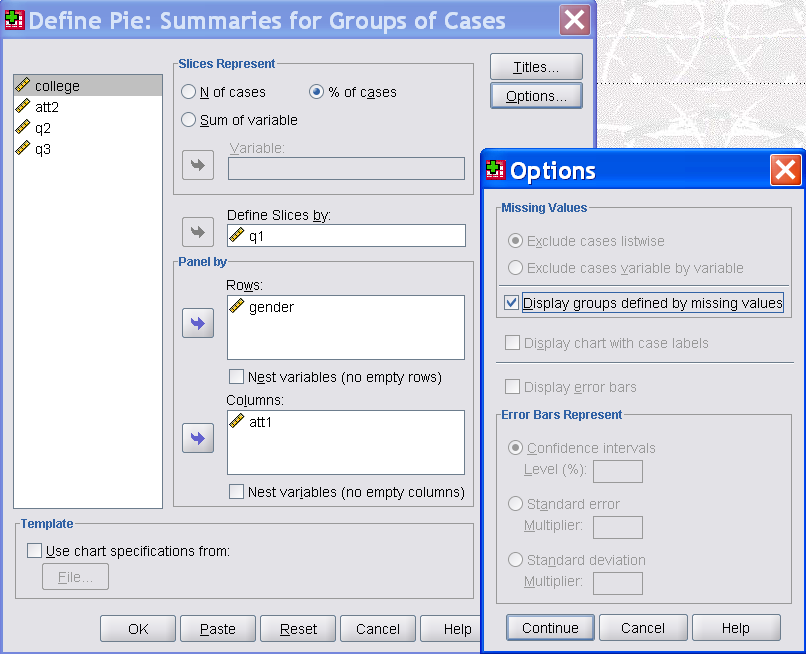
Now you must select the variable that you are going to use to define your slices. (variable q1 is chosen in this example.) You may also split your data based on the Rows and Columns in the 'Panel by' in order to compare the pie charts for different combinations of Row and Column variables. In this example, we split the data by Gender as Row and College as Column. The output will be many pie charts, one for each combination of Gender and College. Click on 'Options' to open 'Options' dialog that allows you to decide how you want to treat missing category. Click Continue to close the 'Options' dialog box, then, click OK to create Pie Charts. Other changes can be made to the other default choices, if you desire. |
Editing a Legacy Dialogs Graph
|
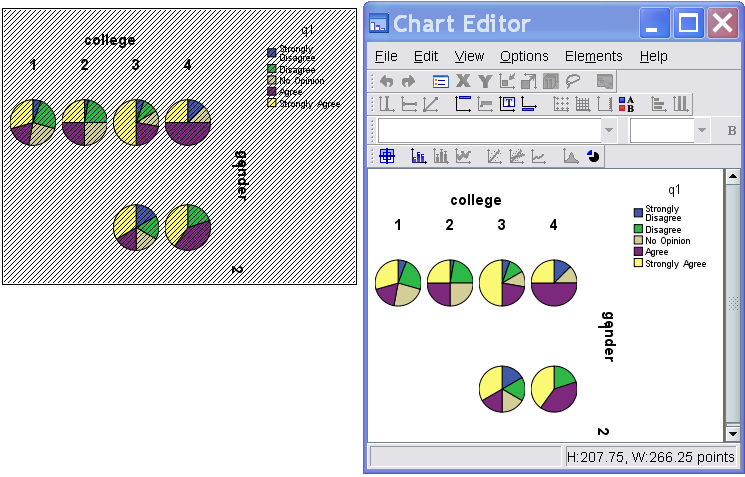
To edit a Legacy Dialogs graph, double click on the graph, a Chart Editor window appears. Alternatively, you can also right-click on the chart and select “Edit Content” and then select “In separate window”.
The editor has three horizontal rows of toolbars on the top. These toolbars provide shortcut icons. Moving the cursor to an icon, a text label will show the function of the icon. To edit the graph, simply double click on the part of graph you want to edit, and a “Properties” dialog box will appear for you to make changes. After making the changes, click on “Apply” to effect the changes and then close the dialog box. You can also right-click on the graph to edit it. After finishing the editing, close the Chart Editor window to go back to the Output Window. The Chart Editor window has the following menus:
|
![]()
![]()
©This online SPSS Training Workshop is developed by Dr Carl Lee, Dr Felix Famoye and student assistants Barbara Shelden and Albert Brown , Department of Mathematics, Central Michigan University. All rights reserved.