|
|
 In this Tutorial:
|
|
||||||||
In this on-line workshop, you will find many movie clips. Each movie clip will demonstrate some specific usage of SPSS.
Cluster Analysis: Cluster analysis is often called the 'non-supervised technique'. It is a multivariate technique used to determine group membership for cases or variables. In cluster analysis, the number of groups and the members of the groups are unknown. A cluster analysis of variables is like a factor analysis. A cluster analysis of cases is like a discriminant analysis. SPSS provides hierarchical cluster analysis and k-means cluster analysis. The hierarchical cluster analysis is for either cases or variables. The k-means cluster analysis is for cases only when we have a large number (n 200) of cases. By using a distance measure the hierarchical algorithm combines closest pair of cases or variables to form a cluster. This technique continues to join pairs of cases (or variables) or cluster until the final step where all cases (or variables) are joined to form one cluster. Once two cases (or variables) are joined in earlier step, they remain together through out the process. When some variables have large values or different scales of measurement, they should be standardized before using them in cluster analysis. Data for cluster analysis could be interval, count or binary. There are different distance measures depending on the type of data. Hierarchical cluster analysis provides way to automatically standardize the variables but one has to do standardization prior to using k-means cluster analysis.
This technique is common for reducing dimensionality among cases (case dimension reduction) or among variables (variable dimension reduction). Researchers usually take one step further by trying to make a meaningful interpretation of the common properties for each cluster, and by combining each cluster into a new single variable or a case, which are then used in other analyses.
A few important considerations for a successful cluster analysis:
|
Different measurement scales among different variables have dramatic influence on the clusters. It is important to make some kind of standardization of the measurement scales. | |
|
Outlying cases often dominate some clusters. It is important to take care of outliers. | |
|
Cluster analysis depends on the distance measures used for clustering. It is important to identify proper distance measure for the problem of interest. SPSS has a set of defaults. If you do not know what would be appropriate, the default options are usually the more commonly used. | |
|
The determination of the final number of clusters may differ from different criteria. It is a good idea to use several selection criteria to help you to choose the final number of clusters. | |
|
The context behind the problem of study is an important consideration in the choice of clustering techniques and the criteria for selecting the number of clusters. |
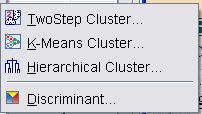
Two Step Cluster Analysis: This is an exploratory data analysis to determine clusters within a data set. This procedure works with both continuous and categorical variables. Cases are clustered based on the variables which could be continuous or categorical. To obtain a Two Step cluster analysis, go to Analyze, Classify, Two Step Cluster. This opens the main dialog box of Two Step Cluster Analysis. Select the distance measure, number of clusters and clustering criterion. The submenus are:
|
Options- This is where you select standardized variables and those to be standardized. | |
|
Plots- Enables you to select plots. | |
|
Output- Enables you to export final model. |
K-Means Cluster Analysis: This is used to cluster cases when you have a large number of cases. The analysis requires one to specify the number of clusters. To run k-means cluster analysis, go to Analyze, Classify, k-Means Cluster. Select the variables and the classification method. There are three submenus:
|
Iterate- Allows you to select options for the iteration algorithm. | |
|
Save- Allows you to save results from the analysis. | |
|
Options- Allows you to select some results for display. |
Hierarchical Cluster Analysis: This is used to cluster variables (or cases). One can analyze raw variables or use a variety of standardization to transform the variables. To run a Hierarchical Cluster Analysis, go to Analyze, Classify, Hierarchical Cluster. Select the variables for the analysis. Select cases or variables to cluster. By default, statistics and plots will be displayed. The main dialog box has the following submenus:
|
Statistics- Agglomeration schedule shows the cases or clusters combined at each state. Proximity matrix shows the distances/similarities between items. You can also display cluster membership by requesting a single solution or a range of solutions. | |
|
Plots- You can request dendrogram. By default, icicle of all clusters is displayed. You can turn this off. You can also select an orientation pattern. | |
|
Method- Here, one selects the cluster method, select the type of measure, choose whether to transform data values. Transform measures allows you to transform the distance measure values that are generated. | |
|
Save- Allows you to save cluster membership. This can be saved as a single solution or a range of solutions. |
The demonstration in the following movie clip is for hierarchical cluster analysis. For other techniques, one may refer to the SPSS Help menu for additional information.
![]() click
here to watch Cluster Analysis
click
here to watch Cluster Analysis
The data set for demonstrating regression modeling is the Tech Survey data set. See Data Set page for details. The purpose is to cluster question Q31a1 through question Q31a12 into a few small number of common groups. These questions deal with the level of difficulty that faculty have when they use technology in their classrooms. These questions are rated on a scale of 1 to 5, where 1 is least difficult to use and 5 is the most difficult to use. These same variables in the tech survey data were used in Factor Analysis clip, where two factors were extracted. Factor one was made up of Q31a1 through Q31a8 and factor two contained Q31a9 through Q31a12.
![]()
![]()
This online SPSS Training Workshop is developed by Dr Carl Lee, Dr Felix Famoye , student assistants Barbara Shelden and Albert Brown , Department of Mathematics, Central Michigan University. All rights reserved.