SPSS On-Line Training Workshop

SPSS On-Line Training Workshop |
|
|
 In this Tutorial: |
||||
|
||||
In this on-line workshop, you will find many movie clips. Each movie clip will demonstrate some specific usage of SPSS.
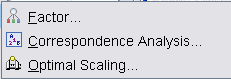
Factor Analysis enables us to do Factor Analysis. This procedure is for taking a large number of variables and reducing them into a small number of factors that explain most of the variance that is observed with the large number of variables.
|
Selection variable: Allows you to limit the analysis to certain levels of a variable. |
The “Factor Analysis” dialog box has the following submenus:
|
Descriptives- This is chosen if you want descriptive statistics for all the chosen variables. One can also obtain the correlation matrix. | |
|
Extraction- This is where you choose the method you want to use for the extraction. Principal components (the default) is the method most often used. You can either choose to extract eigenvalues over a specified value, or you can choose the number of factors to extract. | |
|
Rotation- You choose rotation to make the results easier to interpret. The default rotation is none, so if you want this feature, you must choose it. Varimax is the rotation method that is most popular, although there are others. | |
|
Scores- If you would like to save the scores obtained by the factor analysis, you must choose the scores subdialog box and check “Save as variables”. | |
|
Options- This is chosen to control how the coefficients are displayed and how to handle missing values. |
![]() Click
here to watch Factor Analysis
Click
here to watch Factor Analysis
The data used for this demonstration is the Tech Survey data set. See Data Set page for details. The purpose is to determine a small set of factors that represent as much information as the entire 12 variables from question Q31a1 through question Q31a12. These questions deal with the level of difficulty by faculty when they use technology in their classrooms. These questions are rated on a scale of 1 to 5, where 1 is the least difficult to use and 5 is the most difficult to use. We would like to see if we can reduce these 12 variables into a smaller number of factors.
![]()
![]()
This online SPSS Training Workshop is developed by Dr Carl Lee, Dr Felix Famoye , student assistants Barbara Shelden and Albert Brown , Department of Mathematics, Central Michigan University. All rights reserved.