SPSS On-Line Training Workshop

SPSS On-Line Training Workshop |
|
|
Data input and manipulation is the first step of data analysis. In this page, we will demonstrate how SPSS performances the following tasks using various movie clip:
After learning how to manipulate data, we suggest you to go over the following pages to learn about data analysis and how to analyze your own data: |
||||||||||||||||||||||||
In this on-line
workshop, you will find many movie clips. Each movie clip will demonstrate some specific
usage of SPSS. These clips can be accessed either by clicking on their names, above,
or by clicking on the camera ![]() icon
in the tutorials below.
icon
in the tutorials below.
Data Input/Save (File Menu)
There are four ways for data input in SPSS. These are provided under the File Menu. By clicking on the File Menu in the Data Editor Window, you can select one of the following four ways of data input:
|
New: An empty worksheet will appear for users to enter data into the worksheet. This works just like entering data into a spreadsheet. The first value of data you enter determines the type of variable (whether numeric or string). If a variable is string and you have not defined it to be string, it will only allow you to enter a maximum of characters you have in row 1 of the variable. For example, if you enter �agree� in row 1 of the variable, you will not be able to enter �disagree� in row 2. You can only enter a maximum of five characters that �agree� has. In order to enter �disagree�, you need to modify the variable width by going to the �Data View�. Change the value 5 to the desired number of characters. |
One can first go to the Data View Window to define all variables and their attributes. To do this, Click on the �Data View� tab at the bottom left corner of the Data Editor Window. To modify a cell, click on the cell. For example, to modify a variable name, click on the name and begin to type. To modify the variable type, click on the cell and you will see ellipses. Click on the ellipses and select the correct variable type. To modify the variable width, click on the cell and use the arrow to select the desired width.
![]() Click
here to watch: Getting Started
Click
here to watch: Getting Started![]()
|
Open: Allows users to open an existing SPSS data file (with extension .sav)
that is saved in a jump drive or hard drive. It also allows users to open
many other types of files such as text file (with extension .dat or .txt),
or an Excel file. |
To
save a newly created data set, go to the file menu and follow the instructions
to save your data.
To save and update an existing data set, simply move the cursor to File Menu and
select Save or Save As.
| Select save to keep the existing name | |
| Select save as to change to a different name |
Once a data set is saved using Save or Save As, the data is saved as an SPSS file with the extension .sav. To open the .sav file later, simply use Open in the File Menu. Note that you can save your data in text or ASCII format by selecting the appropriate file type.
Editing Variable Attributes and Creating New Variables (in Data Menu)
Once the data set is created, and the Data Editor Window is active. The Menu Bar at the bottom of the window shows two menus: Data View and Variable View. The following is an example of the Data Editor window.
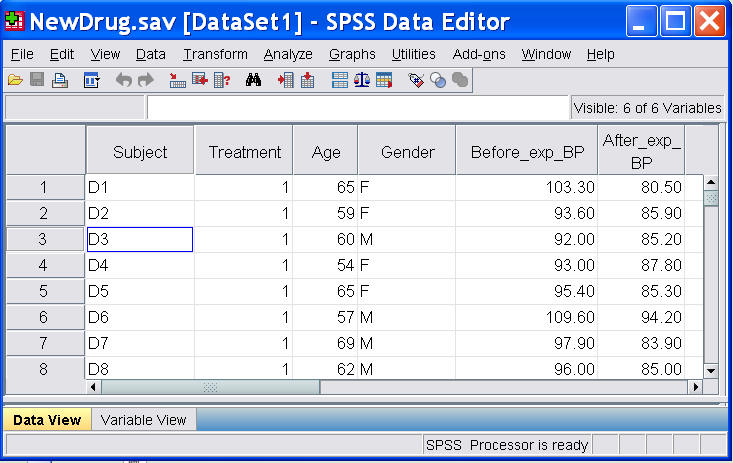
| Click on the Data View to see the data sheet. | |||||||||||||||||||||
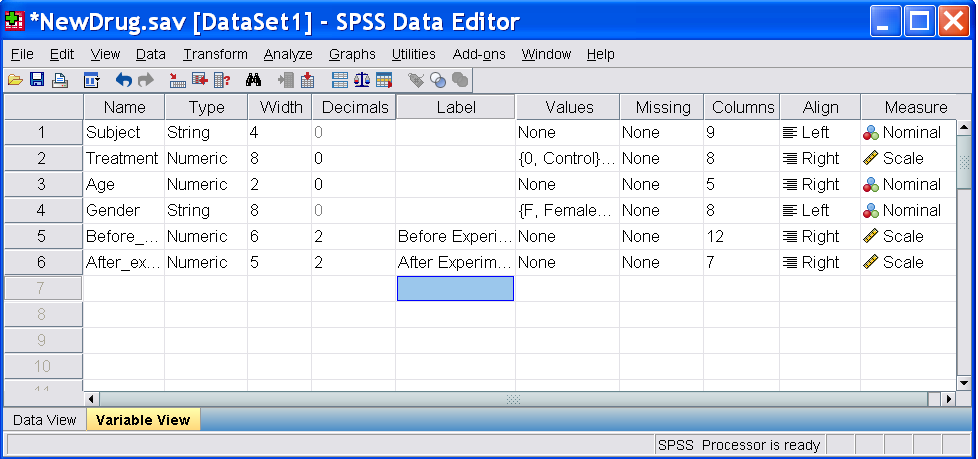
| Click on the Variable View
to see a sheet of information defining each variable. Here is a screen shot
of the Variable View window.
The attributes that are available for editing include:
|
You can copy any defined variable property and paste it to another variable in the Variable View Window. There is no need to repeat the same definition for other variables in the data file.
Often data consists of many variables which share the same value labels. For example, the survey of information technology conducted in the spring, 1999 at CMU consists of fourteen items concerning the level of difficulty when using information technology in a classroom. The choices are
1. No problem at all
2. Some problems
3. Moderate
4. Serious problem
5. Not Applicable
The data recorded for the items are numeric. To define value labels for each item, one can define the value labels for each item, separately. Alternatively, one can create value labels for one question and copy these value labels into the other variables.
![]() Click
here to watch: Defining and Editing Variable Attributes
Click
here to watch: Defining and Editing Variable Attributes![]()
Split File/Select Cases (in Data Menu)
In data analysis, we sometimes need to analyze data for each category of a variable. For example, we may want to compute descriptive statistics for Male and Female groups, separately. In SPSS, before the analysis can be performed, you SPLIT the file by the variable GENDER. This is done by going to �Data� (on the menu bar) and select SPLIT FILE.
Sometimes, you would like to select only a specific group of cases for analysis. In SPSS, before the analysis can be performed, you SELECT CASES. This is done by going to �DATA� (on the menu bar) and then SELECT CASES.
![]() Click
here to watch: Select / Split files
Click
here to watch: Select / Split files![]()
Sort Cases/Merge Files/Transpose (in Data Menu)
Sorting cases is a common tool in data manipulation, where data are sorted based on key variables.
Merge Files allow users to merge two existing SPSS files (with extension .sav) by adding cases or adding variables. In pre/post test data, or data that is collected over several time periods, merge files by variables is handy. In situation where data are entered by more than one individual, merge files by cases will be useful.
Transpose is used when we need to make variables (in columns) as cases (in rows) and make cases as variables.
![]() Click
here to watch: Sort / Merge Files
Click
here to watch: Sort / Merge Files![]()
Variable Transformation and Data Recoding (In Transform Menu)
Sometimes the data that you have is not what is needed for your analysis. For example, you may have the answers given to a number of questions, but what you need to know whether these answers are correct or not. You need to change this data to reflect the correct answers. This is done through data transformation. Variable transformation is used very often in data analysis. This includes not only data transformation of an existing variable such as log transformation, but also includes creating new variables, redefining values of a variable and so on. Two most commonly used tools are Compute and Recode under the Transform Menu.
Variable Transformation: Compute
You can use the Compute command in the Transform Menu to transform data. To do this, you must first name a target variable. Then you must specify the conditions necessary to change the data. For example, if you wanted to score a question, you would make your variable equal to 1, if the question was answered correctly. However, this only gives you a transformation for the correct answer - it leaves all the incorrect answers as blanks. Therefore, you must go back to the compute command to enter that your variable is equal to 0, if the question is answered incorrectly. This transformation takes two steps using the compute command. This transformation technique will involve several steps if the original variable has many values that have to be changed to different unique values. You should consider recode for this type of transformation.
To add some variables or use a formula to compute the value of another variable, one needs to use �Compute�. For example, a new variable may be defines as 5*V1 + 4*V2. This can be accomplished by entering V12 as the target variable and 5*V1 + 4*V2 as the numeric expression.
Data Transformation: recode into a different variable
Recoding into a different variable is much faster. The transformation can be done all in one step. First, you must choose the variable which you are recoding and name the output variable which will hold your new value. Next, you type in the old value and new values. This can be done as many times as necessary to cover all the values of the variable. However, you don�t need to type all these values separately, you can use statements, such as �all other values� or you can define a range that you want to recode into a single value.
Data Transformation: recode into the same variable
Recoding into the same variable is not really much different from recoding into different variables. Again you choose the variable which you are recoding. Again, you would type in old values and new values. When you press OK, your new values replace the old values.Click on the following movie clip to see how to transform the variables:
![]() MOVIE:
Transformation of Variables
MOVIE:
Transformation of Variables
![]()
Statistical Techniques Available in SPSS (in Analyze Menu)
SPSS is a comprehensive statistical package. It is capable of performing many statistical data analyses and report the summary. The procedures available in SPSS are under the Analyze Menu. The results from performing any analysis are displayed in the OUTPUT Editor Window. Details about how to manipulate the Output Editor is given in the Output Editor Window page. In this training workshop, we will not be able to cover all of the statistical techniques available in SPSS. Instead, we will focus on the following:
Reports | |
Descriptive statistics, frequency, crosstabulation | |
Two sample comparison - independent t and paired t | |
Correlation and regression | |
Analysis of variance | |
Repeated measure analysis | |
Nonparametric methods | |
Factor analysis | |
Reliability analysis | |
|
Generalized linear models | |
|
General Log-linear models | |
|
Mixed models | |
|
Logistic regression | |
|
Cluster analysis | |
|
Time Series | |
|
Survival models | |
|
Quality Control | |
|
ROC curve |
Each of these techniques will be demonstrated using projects. Details about the projects and corresponding movie clips are given in the Project page. The following clips will give you a quick glance of some data analysis procedures:
![]() click here to watch: Overview of SPSS
click here to watch: Overview of SPSS
![]() click here to watch: Getting Started
click here to watch: Getting Started
![]() click here to watch: Statistical Procedures
click here to watch: Statistical Procedures
For details on how to perform each of these statistical procedures, you should go to
For details about how these statistical techniques are apply these techniques in real projects, you should go to
For details of all topics and movie clips, you should go to
Graphic Tools (in Graphs Menu)
Graphic tools are always important in data analysis. SPSS has most of the common tools needed for data analysis. Under the Graph Menu, you can find two types of graphical tools.
Interactive Graphs can be modified interactively. | |
Regular graphical tools can be modified as well. |
There may be some difference in appearances between these two types of graphics for the same type of graph. For example, you will see Bar chart in both Interactive Graph and Regular Graph. The appearances are somewhat different. Try both to see which one is best for your analysis.
The graphs are kept in the Output Editor Window. Details on how to manipulate the graphs are given in the
Output Window Page and Chart Editor Window Page .
These windows can be selected as the Active window by going to "Window" (on the menu bar) and select the intended editor window. The following clips will give you a quick glance of graphical tools:
![]()
![]()
©This online SPSS Training Workshop is developed by Dr Carl Lee, Dr Felix Famoye and student assistants Barbara Shelden and Albert Brown , Department of Mathematics, Central Michigan University. All rights reserved.