(b) The interpretation of diagrams
For distillation, both vapor and liquid compositions are of
interest. Thus we combine the liquid composition diagram and vapor composition
diagram into one.
Point a represents the vapor pressure of a mixture with liquid
composition xA and b represents the composition of the
vapor that is in equilibrium with the liquid at that pressure. Note that when two phases are in
equilibrium, P = 2, so F’ = 1. Thus if
composition is specified, the pressure at which the two phases are in
equilibrium is fixed.
As we decrease the pressure we travel down the isopleth a
(constant composition vertical line) to a4, at p1 we have liquid
with composition a1 with very little vapor at composition a1’. At p2 we have liquid with
composition a2 and vapor with
composition a2’ in equilibrium ( the overall composition of the system is
a2”). Note also that the two phases are in
equilibrium and F’ = 1 for all points between the two lines. Hence for a given
pressure (such as p2) the variance is zero, and the vapor and liquid phases have
fixed compositions. At p3 we have very little liq with composition a3 in equilibrium
with mostly vapor at composition a3.
At a4 we have pure vapor only.
(c) The Lever Rule
A point in the two-phase region of a phase diagram indicates not
only qualitatively that the liquid and vapor are present, but represents
quantitatively the relative amounts of each.
To find the relative amounts of two phases a & b in equilibrium,
we measure distances on the tie line, la and lb between the two
phases and use the lever rule:
![]()
where na
is
the amount of phase a and nb
is
the amount of phase b.
8.4 Temperature-composition diagrams
To discuss distillation, we need a temperature composition diagram (pressure is held constant).
(a) The distillation of mixtures
The region between the lines in the above figure is a two-phase region with F’ = 1 and hence at a given T, the composition of the phases in equilibrium are fixed.
As we heat the liquid with composition from a1, it will start
to boil when it reaches T2. The vapor will be
richer in the more volatile component (A) and will have composition a2’.
In a simple distillation the vapor is withdrawn and
condensed. If the vapor is completely
withdrawn and condensed the first drop gives a liquid of composition a3, which is richer
in the more volatile component, A, than the original liquid.
In Fractional distillation, the boiling and condensation
cycle is repeated successively. We can
follow the next change by examining what happens when the condensate of
composition a3 is reheated. The
mixture will now boil at T3 and the composition of the vapor will be a’3. Then we go to a4 etc.
The efficiency of a fractionating column is expressed in terms of
the number of theoretical plates, the number of effective vaporization
and condensation steps that are required to achieve a condensate of a given
composition from a given distillate.
(b) Azeotropes
A maximum in a phase diagram may occur when favorable interactions
between A and B molecules reduce the vapor pressure of the mixture below the
ideal value. The excess Gibbs energy is
negative so the mixing is favorable and the liquids are miscible. Examples are
trichloromethane/acetone and nitric acid/water mixtures.
Phase diagrams showing a minimum indicate that the mixture is
destabilized relative to the ideal solution, the A-B interactions then being
unfavorable. For such mixtures GE is positive
(less favorable to mixing than ideal), Examples are dioxane/water and ethanol
water mixtures.
Deviations from ideality have important consequences for
distillation.
Consider a liquid composition of a in the low boiling azeotrope.
The vapor (at a'2) of the boiling mixture (at a2) is richer in
A. If that vapor is removed (and
condensed elsewhere) the remaining liquid will move to a composition that is
richer in B, such as that represented by a3, and the vapor
in equilibrium with this mixture will have composition a'3. The boiling
point of the liquid drops and the vapor becomes richer in B. When the remaining liquid reaches
composition b, the vapor has the same composition as the liquid. Evaporation occurs without change of
composition. The mixture is said to
form an azeotrope. When the
azeotrope is reached the two liquids cannot be separated.
8.5 Liquid-liquid phase
diagrams
We will study temperature-composition diagrams for systems that
consist of pairs of partially miscible liquids, (liquids that do not mix
in all proportions at all temperatures).
When P = 2, F' = 1, and fixed T will determine compositions of the
immiscible liquid phases.
(a) Phase separation
Suppose small amount of B is soluble in A, as we add more B, the
stage comes when no more B dissolves and a second phase (P = 2) appears. Under this condition the most abundant phase
will be A saturated with B (point a”) and the minor phase will be B saturated
with A (point a’). Relative abundance's
of the two phases are given by the lever rule.
Example 8.2 Interpreting a liquid-liquid phase diagram
A mixture of 50 g of hexane (0.59 mol) and 50 g nitobenzene (0.41
mol) was prepared at 290 K. What are
the compositions of the phases, and what proportions do they occur? To what
temperature must the sample be heated to obtain a single phase?
Method: The compositions of
the phases are given by the points where the tie line through the point
representing the temperature and overall composition of the system intersects
the phase boundary. Their proportions
are given by the lever rule. The
temperature at which the components are completely miscible is given by
following the isopleth upwards and noting the temperature it enters the
one-phase region of the diagram.
Answer: We denote hexane by H and nitrobenzene by N. The point xN = 0.41, T = 290,
occurs in the two-phase region of the diagram.
The tie line indicates the phase boundaries at xN = 0.35 and xN = 0.83 (the
compositions of the two liquid phases).
The ratio of the amounts of each phase is equal to the ratio of
the distances la and lb.
There is about 7 times more nitrobenzene-rich phase than the
hexane-rich phase. Heating the sample
to 292 K takes it into a single phase region.
(b) Critical solution temperatures
The upper critical solution temperature (upper consolute temperature),
Tuc, is the highest temperature at which phase separation
occurs. Above this temperature, the two
components are fully miscible. This
exists because the greater thermal motion will overcome any potential energy
advantage in molecules of one type being close together.
Some systems show a lower critical solution temperature (lower
consolute temperature), Tlc, below which they mix in all
proportions and above which they form two phases. An example is water and triethylamine. In this case at low T, they form a complex that breaks up at
higher T. Some systems have both!
(c) The distillation of partially miscible liquids
Consider a pair of liquids that are partially miscible and form a low boiling azeotrope (a common system, because both properties reflect the tendency of the two kinds of molecules to avoid each other).
The figure shows the phase diagram of a system in which the liquids become
fully miscible before they boil. Distillation of a
mixture at a1 leads to vapor with composition b1, which condenses
to completely miscible solution at b2.
Phase separation only occurs when the distillate is cooled to a point in
the two-phase region such as point b3.
This description only applies to the first drop of distillate. If distillation continues, the composition
of the remaining liquid changes. In the
end, when the whole sample has evaporated, the composition is back to a1.
This figure is for the situation in boiling occurs before complete miscibility. There is no upper critical solution temperature.
The distillate obtained from a liquid initially of composition a1 has composition b3 and is a two-phase mixture. One phase has composition b'3 and the other has composition b"3.
The behavior represented by isopleth e is interesting. A system at e1, forms two phases, which persist (but with changing proportions) up to the boiling point e2. The vapor of this mixture has the same composition as the liquid (azeotrope). Similarly, condensing a vapor of composition e3, gives a two-phase liquid of the same overall composition. At fixed temperature, the mixture vaporizes and condenses like a single substance.
Example 8.3 Interpreting a phase diagram
State the changes that occur when a mixture of composition xB = 0.95 is boiled
and the vapor condensed.
Method The area in which the point lies gives the number of
phases; the compositions of the phases are given by the points at the
intersection of the horizontal tie line with the phase boundaries; relative
abundance's are given by lever rule.
Answer The initial point is a one phase region. When heated, boiling occurs at T = 370 K and
composition of liquid at a2. The vapor comp is
xB at b1 = 0.66. The liquid gets richer in B, and the last
drop (of pure B) evaporates at 392K. If
the initial vapor is drawn off it has composition of xB = 0.66.
The composition would be maintained if the sample were very large,
but for a finite sample it shifts to larger values and ultimately to xB = 0.95. Cooling the distillate corresponds to moving
down the xB = 0.66 isopleth. At
350 K, the liq phase has composition xB = 0.87, and the vapor, xB = 0.49. Their relative proportions are 1:3. at 340 K, the sample is entirely liquid and
consists of three phases, the vapor and two liquid phases. One liquid phase has composition xB = 0.30, the
other xB = 0.80, in the ratio of 0.62:1.
Further cooling moves the system into a two phase region, and at
298 K the compositions are 0.20 and 0.90 with ratio 0.82:1. As further distillate boils over, the overall
composition of the distillate becomes rich in B. When the last drop has been condensed, the phase composition is
the same as at the beginning.
8.6 Liquid-solid phase diagram
Consider the two-component liquid of composition a1 in the diagram
above. The changes can be described as
follows:
(1)
a1®a2.
The system enters the two phase region labeled 'liquid + B'. Pure solid B begins to come out of solution
and the remaining liquid becomes richer in A.
(2)
a2®a3. More of the solid forms, and the
relative amounts of the solid and liquid (which are in equilibrium) are given
by the lever rule. At this stage there
are roughly equal amounts of each. The
liquid phase is richer in A than before (composition given by b3) because some B
has been deposited.
(3)
a3®a4. At the end of
this step, there is less liquid than at a3, and its
composition is given by e. This
liquid now freezes to give a two-phase system of pure A and pure B.
(a) Eutectics
The isopleth at e corresponds to the eutectic
composition. A liquid with the
eutectic composition freezes at a single temperature, without previously
depositing solid A or B. A solid with
the eutectic composition, melts without change of composition at the lowest
temperature of any mixture. Solutions
with compositions to the right of e deposit B as they cool, and those to the
left deposit A as they cool. Only the eutectic mixture (apart from pure A or
solid B) solidifies at a single definite temperature (F' = 0 when C =2 and P =
3) without gradually unloading one or other of the components from the liquid.
Thermal analysis is a practical way of detecting eutectics. When a liquid reaches its eutectic
composition, the temperature remains constant (F' = 0) until the whole sample
solidifies. This is known as a eutectic halt.
b) Reacting systems
Many binary mixtures react to produce compound. The GaAs system is a technologically
important one. Ga + As = GaAs, a
two-component system with three constituents.
We will denote the compound AB as C.

The principle change from the eutectic phase diagram is that the
whole of the phase diagram is squeezed into the range of compositions lying
between equal amounts of A and B (xB = 0.5) and pure B. This tells us that the compound is formed of
equimolar amount of A and B, AB (not A2B or AB3). The solid deposited on cooling along the
isopleth a is the compound C. At temperatures below a4 there are two
solid phases, one consisting of C and the other of B. At compositions on the left half of the diagram the solid
consists of A and C.
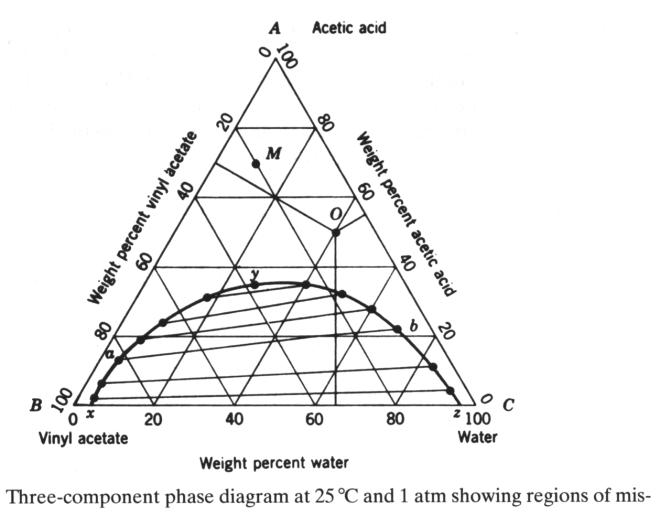
Three-component phase diagram
At any pint, the weight %'s add up to one. Water and vinyl acetate are only partially
miscible in a two-component system.
Acetic acid and vinyl acetate are totally miscible as well as water and
acetic acid in the respective two-component mixtures. The diagram is now for a fixed T and p.