Visual analytics for science and technologies
SAVE: Sensor Anomaly Visualization Engine
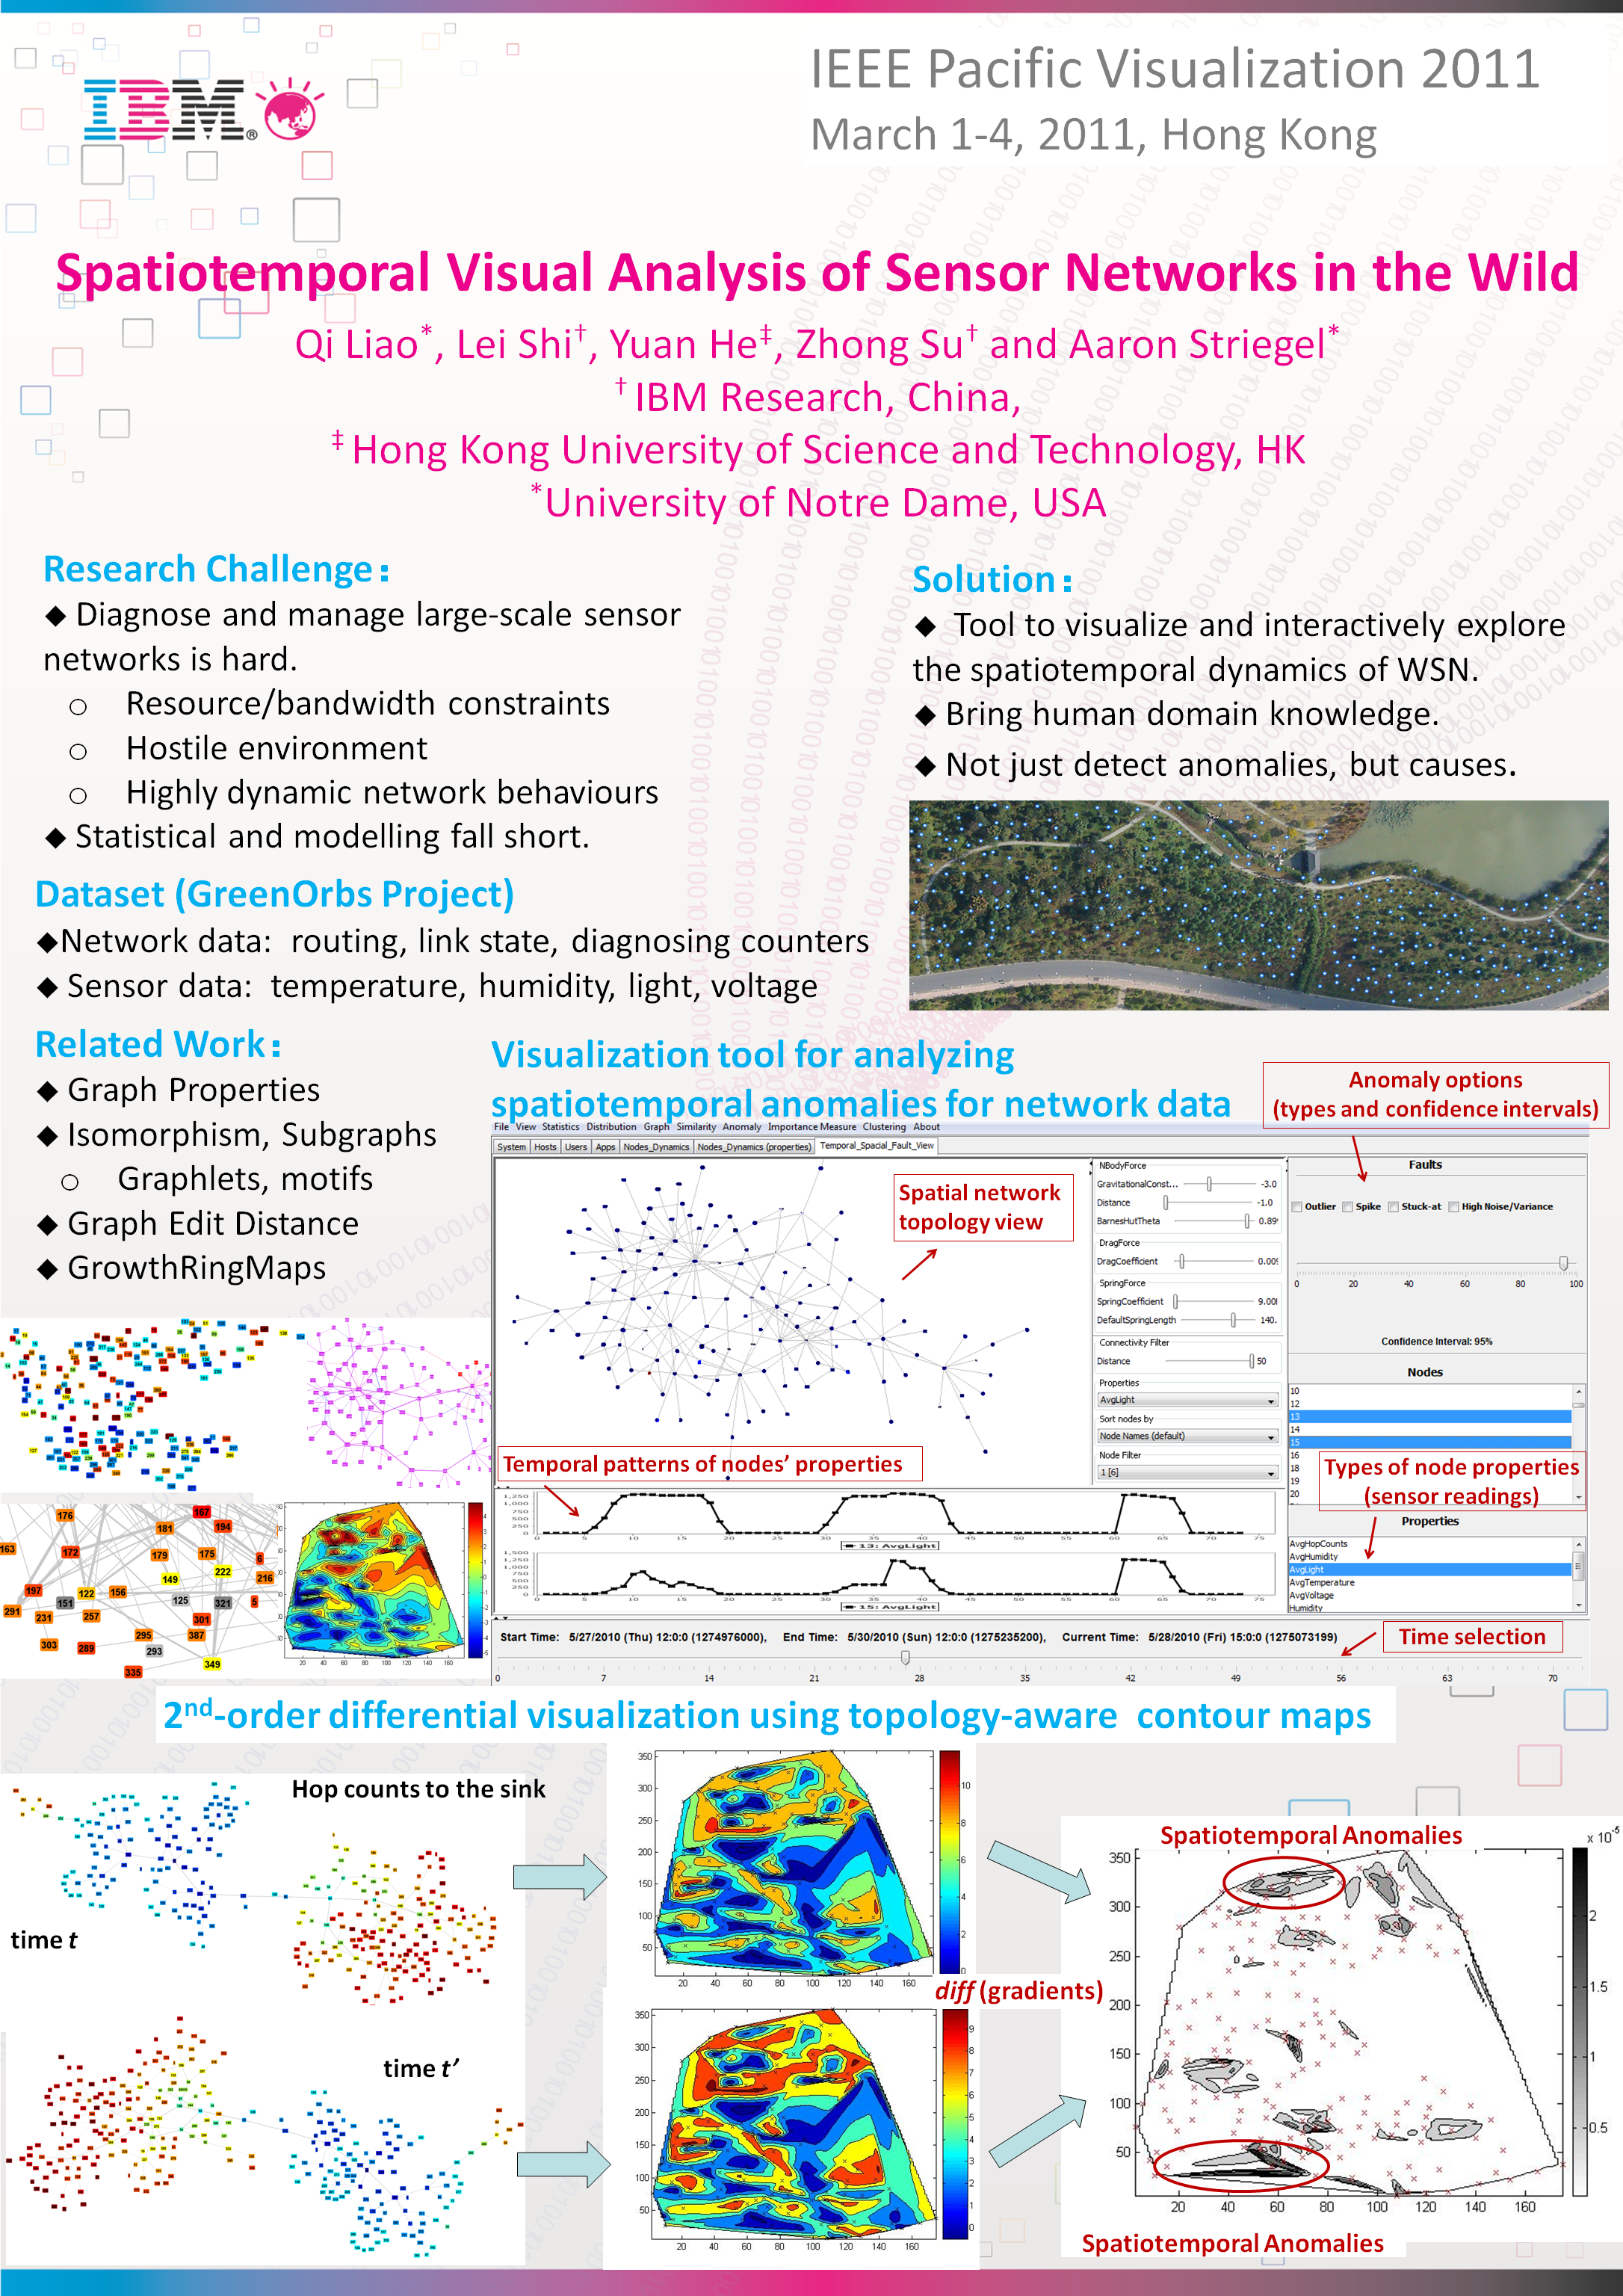
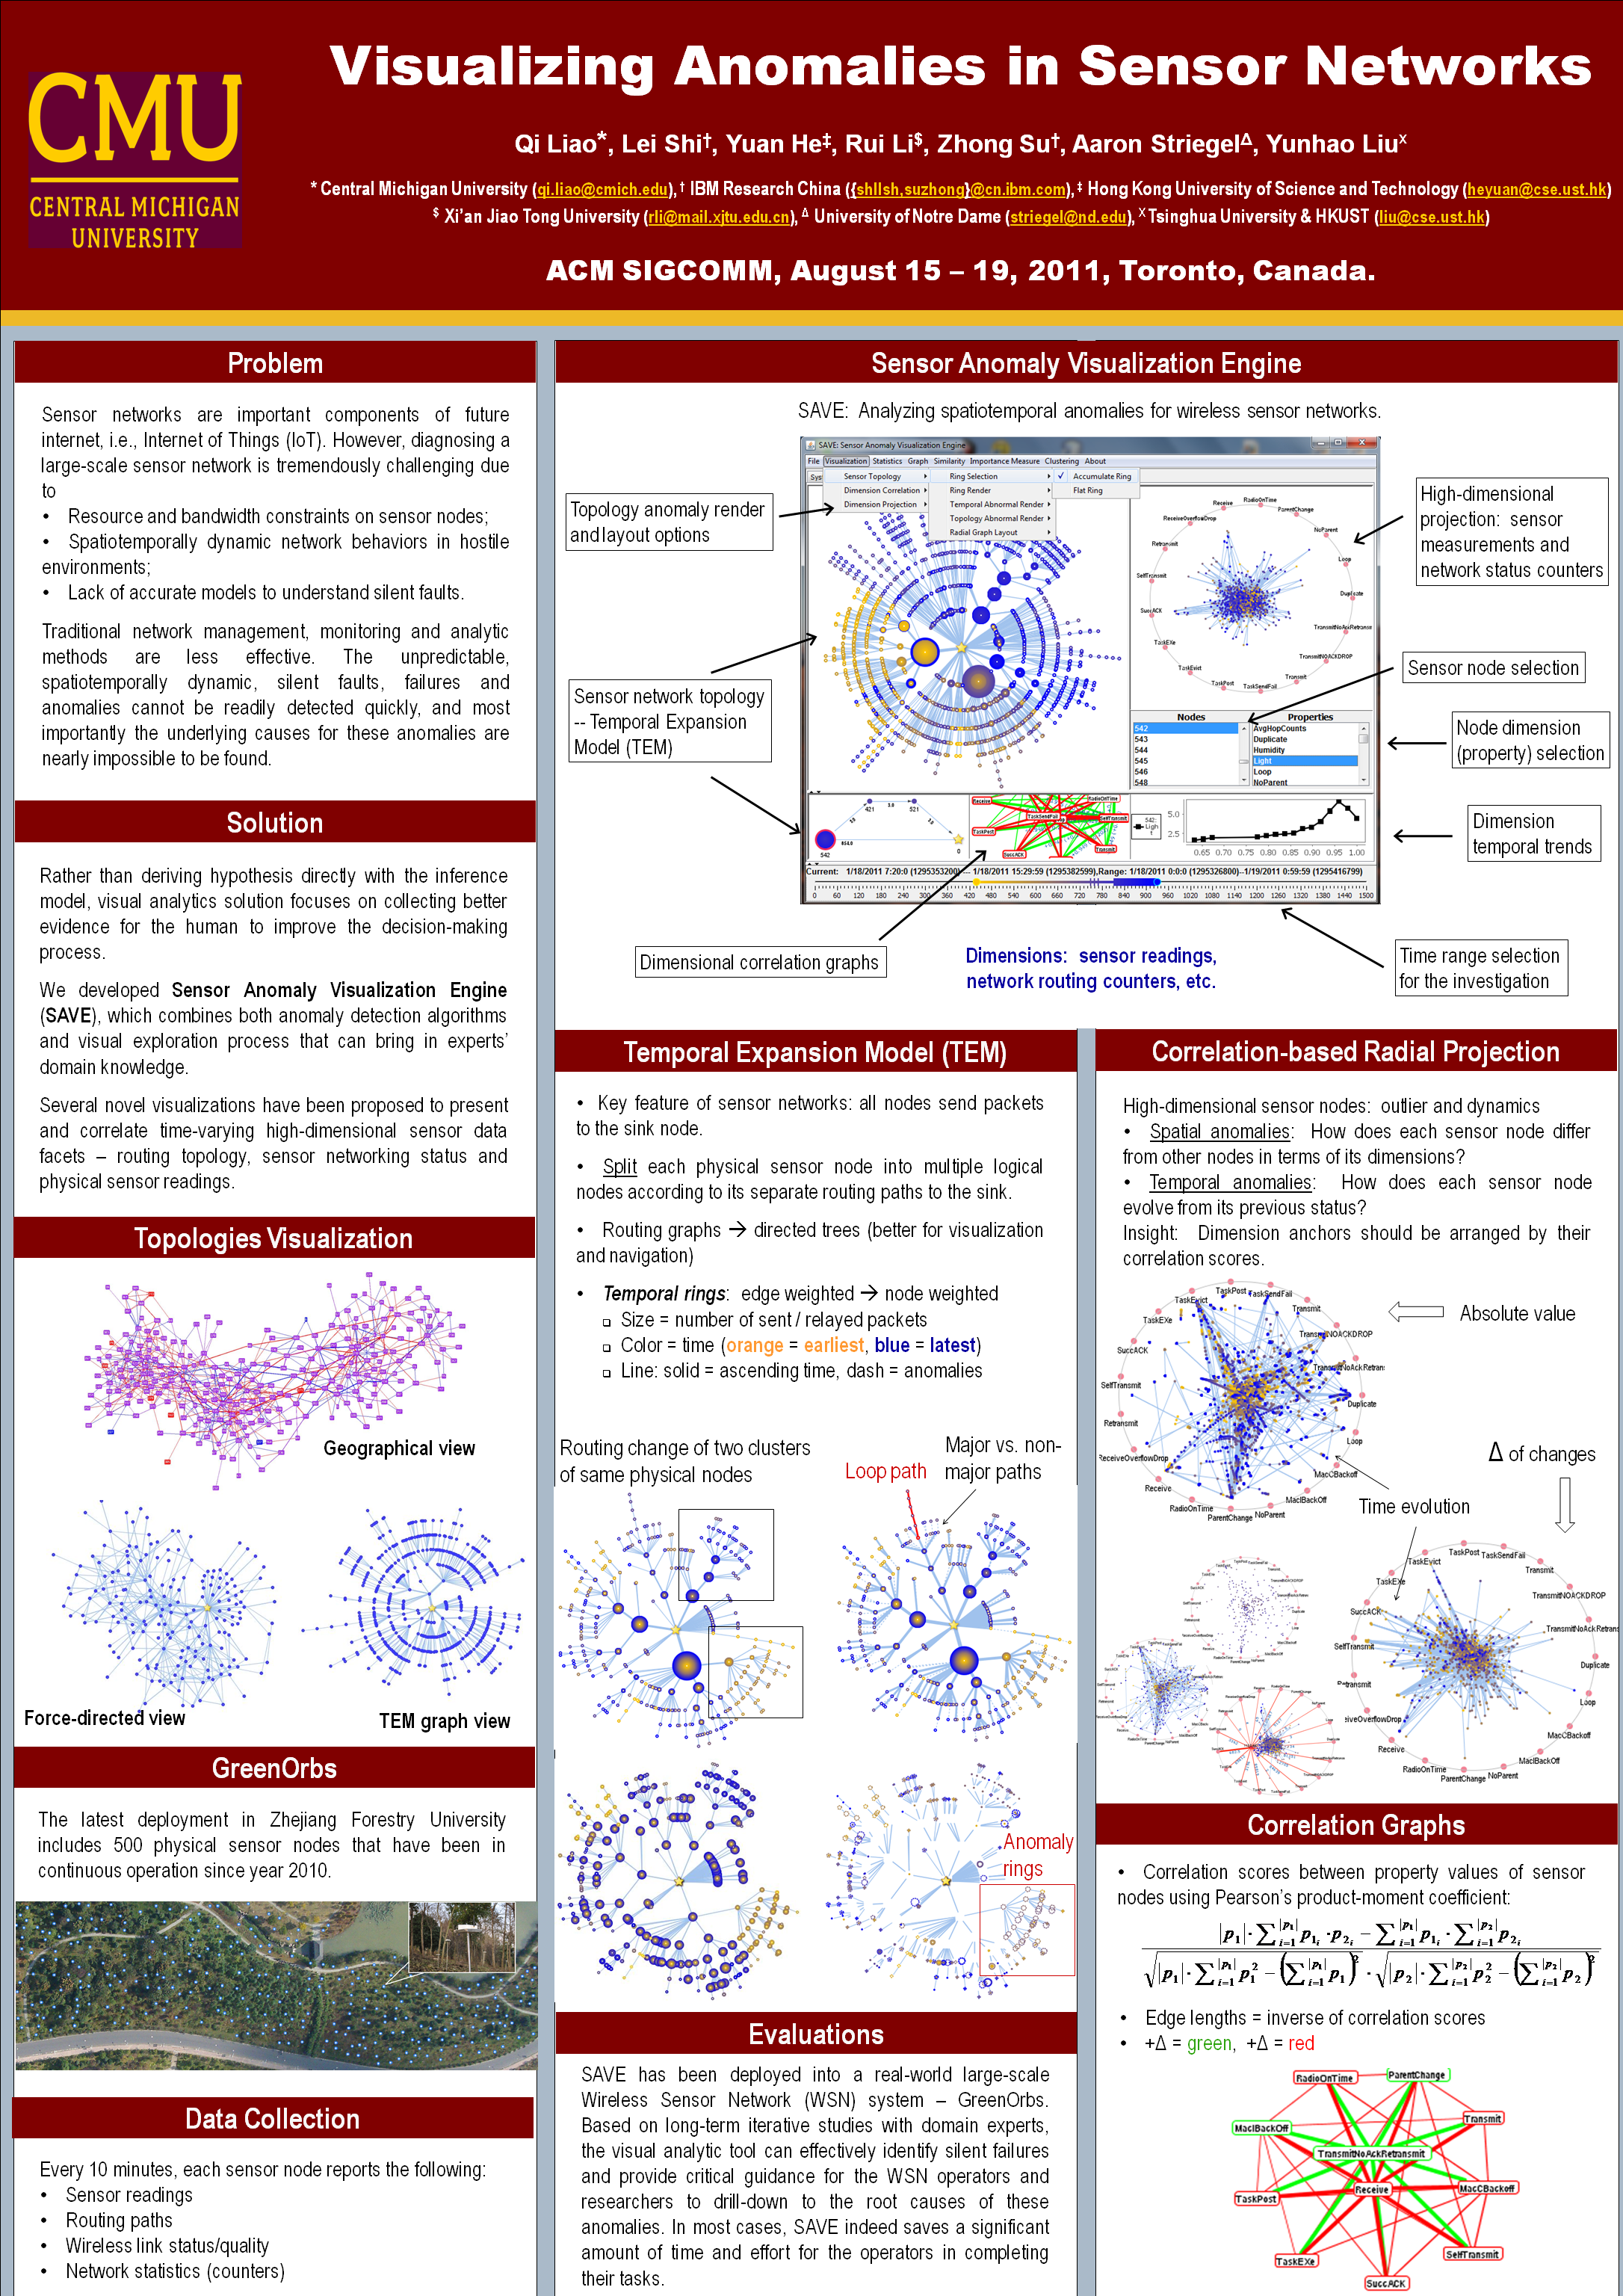
Sensor networks are important components of future internet, i.e., Internet of Things (IoT). However, diagnosing a large-scale sensor network is tremendously challenging due to
Traditional network management, monitoring and analytic methods are less effective. The unpredictable, spatiotemporally dynamic, silent faults, failures and anomalies cannot be readily detected quickly, and most importantly the underlying causes for these anomalies are nearly impossible to be found.
Rather than deriving hypothesis directly with the inference model, visual analytics solution focuses on collecting better evidence for the human to improve the decision-making process. We developed Sensor Anomaly Visualization Engine (SAVE), which combines both anomaly detection algorithms and visual exploration process that can bring in experts’ domain knowledge. Several novel visualizations have been proposed to present and correlate time-varying high-dimensional sensor data facets – routing topology, sensor networking status and physical sensor readings.
Posters
Pacific Visualization, March 1-4, 2011, Hong Kong [view]
|
ACM SIGCOMM, August 15-19, 2011, Toronto, Canada [view]
|
Demo
|
SAVE: Analyzing spatio-temporal anomalies for wireless sensor networks Diagnosing a large-scale sensor network is a crucial but challenging task. The reasons are due to the resource and bandwidth constraints on sensor nodes, the spatiotemporally dynamic network behaviors, and the lack of accurate models to understand such behaviors in a hostile environment. In this paper, we present SAVE (Sensor Anomalies Visualization Engine), a system that fully leverages the power of both visualization and anomaly detection analytics to guide the user quickly and accurately diagnose sensor network failures. SAVE combines several customized visualizations over separate sensor data facets as multiple coordinated views. Temporal expansion model, correlation graph and dynamic projection view are proposed to effectively interpret the topological, correlational and dimensional sensor data dynamics and their anomalies. Through case study with real-world sensor network system and administrators, we demonstrate that SAVE is able to help better locate the problem and further identify the root cause of major sensor network failure scenarios.
|
Research and teaching

Read more on the research projects and course offerings.
Current projects
Current classes