Pair Distribution
Function
Analysis is a method of extracting structure-related information from
powder
diffraction data. Unlike other better known methods, PDF analysis can
provide
information not only about the long-range (>100Å) atomic
ordering
but also for the short-range ordering in materials. This is because the
technique
takes into account both the Bragg as well as diffuse scattering (which
is
known to be related to short-range order effects). This sensitivity to
the
local structure has made the PDF analysis the tool of choice for
structural
studies of amorphous materials. Only recently (though very succesfuly)
the
PDF analysis has been applied to (poly)crystalline materials with
significant
intrinsic disorder, including nanocrystals. Important knowledge
about
the short-range atomic arrangement in semiconductors, superconductors
and
other materials of technological importance has been obtained. Despite
the
increasing interest in the study of the local structure of a great
variety
of materials, PDF analysis is still not widely used. In our
understanding,
the reason for this is that the existing software for retriving
structural
information from experimental Pair Distribution Functions (PDF) is not
as
user-friendly as it should be. The aim of this manual is to show the
PDF method
is applied to study the structure of a typical nanocrystalline material
and
to outline the most important steps in the PDF study. We hope that even
researchers
who do not have any experience in PDF analysis can follow the steps,
run
the programs, compare their results with ours, and (why not?) find
better
solution.
1. How reliable are the results from a PDF analysis?
The
best way to answer this question is to compare the results obtained
from
PDF analysis with those obtaned by other well established techniques.
Such
a comparison has been done for a number of crystalline materials,
such
as Ni, GaAs, GdAl2, etc. The results have shown excellent
agreement
between the structural data obtained by PDF analysis and those obtained
with
other methods.
Here, we compare structure data for crystalline LiMn2O4
(cubic, spinel-like structure) obtained by PDF analysis and the
Rietveld
method. This material is with cubic, spinel-like structure that may be
viewed
as a three-dimensional network of edge-sharing octahedra (Fig.1). The experimental powder diffraction data were
collected
at the 11-ID-C
beamline at the Advanced Photon
Source
of Argonne National Laboratory. The wavelength used was 0.1078Å
(short
wavelength is important for obtaining diffraction data at high wave
vectors).
The diffraction geometry was Debye-Scherrer with a glass capillary
(d=0.5mm).
A file with the experimental diifraction data (corrected for flux
decay,
background, Compton scattering and sample absorption) can be found here. In order to extract structural
information
from the diffraction data we used the Rietveld method, as implemented
in
the program FullProf. The fitted diffraction profile is shown in Fig.2, As can be seen, the structural model (cubic,
spinel-like) accounts very well for all Bragg peaks in the diffraction
pattern. The unit
cell constants and fractional atomic coordinates are shown in Table 1 together with some reliability factors and
goodness-of-fit indicators. The .pcr file (a macro file with the
structure and the necessary
commands) for the Rietveld refinement with FullProf can be
found
here (limn2o4_rietveld.pcr).
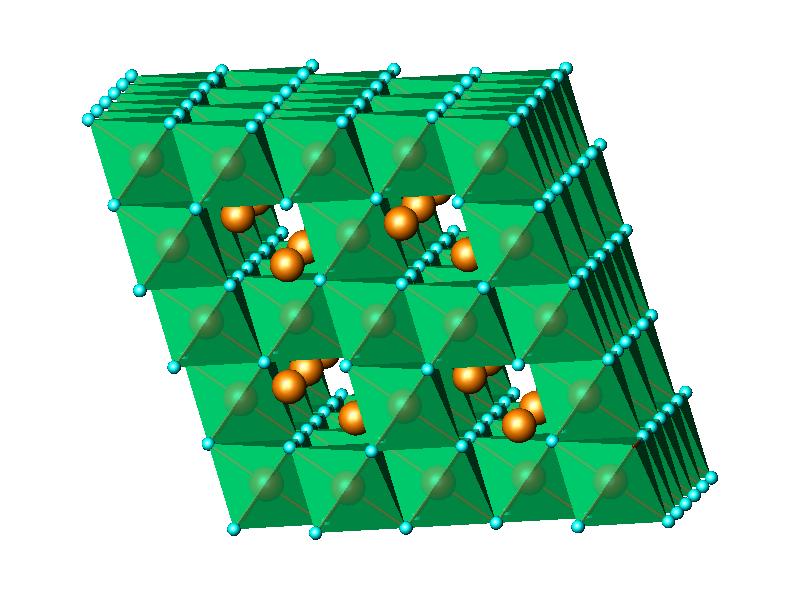
Fig.1 LiMn2O4 cubic spinel structure
The same set of
diffraction
data was used for the PDF analysis. At first, the diffraction pattern
was
corrected for background (using a separate diffraction measurement of
an
empty glass capillary to account for the contributions of the capillary
walls
and air scattering), Compton scattering, detector dead-time,
absorption,
diffraction geometry, pollarization. All these corrections were done
with
the program RAD. Then, the corrected X-ray
diffraction
data were scaled into electron units and the interference function was
calculated
(all these calculations are again done with RAD).
Finally,
The structure function was Fourrier transformed to a PDF. The
experimental
PDF can be found here (spinel.rdf).
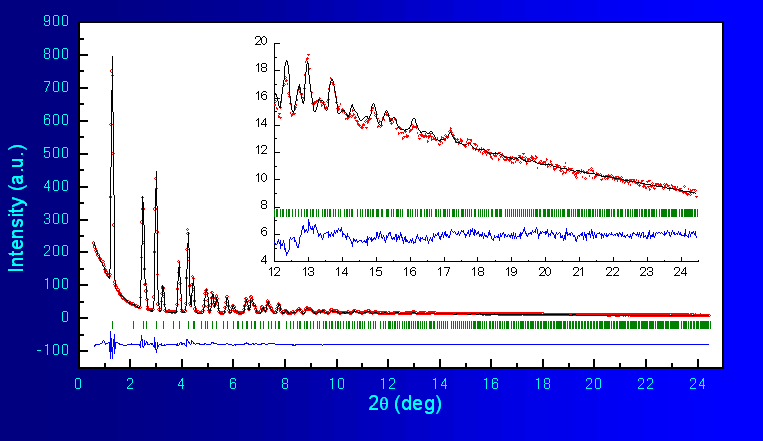
Fig.2 Rietveld Refinement of LiMn2O4
The program
PDFFIT
was used to extract structural information from the experimental PDF.
For
the refinement of the structure, two files are necessary: a structure
data
file (.stru) which is
here
(spinel.stru),
and a
macro file (.mac) with the refinement commands. Our macro file is
here (spinel.mac). For people who are
not
familiar
with PDFfit, an user manual and tutorial are available for download
with
the program. The fitted Pair Distribution Function is shown
in
Fig.3. The refined structural parameters are
summarized
in
Table 1.
Fig.3 Results
from a PDF analysis of LiMn2O4
It is worth noting that the agreement
factors RG
used in the PDF-based refinement appears higher when compared to the
corresponding
Rwp factor used in
the
Rietveld refinement. This does not indicate that the PDF-based fit is
of inferior
quality since it yelds structural parameters that agree quite well with
those
obtained by the Rietveld method. Rather, it reflects the fact that the
experimental
quantities being fit in real and reciprocal space are not the same.
Table 1.
Structural
parameters for LiMn2O4 obtained by the Rietveld refinement method and
PDF
analysis. Atomic positions are refined in the space group Fd-3m.
Method
|
Rietveld
|
PDF
|
a,
Å
|
8.265(2)
|
8.252(1)
|
x(O)a
|
0.3873(2)
|
0.3873(4)
|
B(Mn),
Å2
|
0.57(1)
|
0.85(1)
|
| B(Li),
Å2 |
1.4(3)
|
4.1(1)
|
| B(O),
Å2 |
1.28(7)
|
2.84(8)
|
Rwp(RG),
%
|
10.2
|
16.6
|
a The three atoms in the
asymmetric
unit occupy the following
Wyckoff positions: Mn 16d (5/8,5/8,5/8); Li 8a(0,0,0); O 32e(x,x,x).
Files used in this example:
- limn2o4.dat
Experimental diffraction data collected with λ = 0.1078Å
- limn2o4_rietveld.pcr
File used with FullProf for Rietveld refinement
- spinel.rdf
Experimental Atomic Pair Distribution Function
- spinel.stru
File with structure data used by PDFFIT
- spinel.mac
Macro file with PDFFIT commands
2. How PDF can be applied to nano-crystalline materials?
Many materials that lack long range order (show very few, if any, sharp
Bragg peaks) still possess well defined local struture on the nanometer
length
scale. The structure can be well described with a small number of
parameters,
such as unit cell and symmetry. The PDF-guided structural determination
of
nanocrystalline materials starts with the choice of a plausible
structural
model. Such can be found among the crystalline counterparts of the
material.
If there are several crystalline compounds with similar chemical
compositions,
or if the material exists in a different polymorphic form, all
crystalline
counterparts should be tested. Since no sharp Bragg peaks exist in the
diffraction
pattern of nanocrystalline materials, the usual crystallographic
procedures
that can be used to distinguish between competing structural models are
of
no help. Neither the extinction conditions formalism, nor the
automated
routines for unit-cell search can be applied. So, apart from some
crystal
chemistry considerations, the only way to tell which is the correct
structure
is to compare the PDFs calculated for each of the models with the
experimental
PDF. Then, the model that accounts best for the features of the
experimental
PDF is used to refine the structural parameters of the material under
study.
In this practical example we show results from a structural study of a
nanocrystalline
material with the approximate composition Li
0.54K
0.3MnO
3.0-δI
0.10,
prepared by reacting aqueous solution of KMnO
4 with
1.5
equiv LiI at room temperature[
1]. From the
thermogravimetric analysis, it was obtained that the water
content is about 0.2-0.4 mole water
per unit formula. X-ray diffraction data from the sample were collected
at
the beamline 11-ID-C (Advanced Photon Source, Argonne National
Laboratory)
using X-rays of energy
115.013 keV
(λ=0.1078Å).
The higher energy x-ray were used to extend the region of reciprocal
space
(i.e. to obtain data at higher wave vectors, Q) which is important for
the
success of PDF analysis. The experimental diffraction data are shown on
Fig. 4. The file
hyd.dat
contains
the diffraction data in ASCII
x-y
format.
Fig.4 Experimental powder
diffraction
pattern for nanocrystalline K-Li-Mn-O-I.
The experimental PDF was obtained as follows. First, the coherently
scattered
intensities were extracted from the X-ray diffraction pattern by
applying
appropriate corrections for flux, background, Compton scattering and
sample
absorption. The intensities were normalized in absolute electron units,
reduced
to structure function and Fourier transformed to atomic PDF. All data
processing
was done using the program
RAD. The obtained
experimental
PDF is shown on Fig.5. As can be seen, the oscillations of the PDF
vanish
at about 15Å. The nanocrystalline sample has a very well defined
local
atomic arrangement but lacks the extended order of usual crystals. The
experimental
PDF can be found in the file
hyd.rdf.
To determine the structure of the
nanocrystalline
K-Li-Mn-O-I sample we adopted the following procedure: At first,
plausible
structural models that are consistentwith the experimental PDF data and
available
structural information for the materials under study were looked for.
The
models were matched against the experimental data to identify the most
promising
one. Then, the 3D structure of the nanocrystal was determined through
refining
that model so that it reproduces well all important details in the
experimental
PDF data. A careful inspection of the most prominent features in the
experimental
PDF reveals the following structural characteristics of the studied
nanocrystal:
The first peak in the experimnetal PDF data is positioned at about
1.89Å.
Since this is the typical Mn-O distance in materials with octahedral
oxygen coordination around the manganese atoms, it can be concluded
that the material
should contain MnO
6 octahedra. For comparison, the Mn-O
distance
within tetrahedral MnO
4 units is about 1.66Å.
Our
PDF data rule out the presence of any such units in the sample. The
second
PDF peak appears at 2.88Å, which is the typical Mn-Mn distance
for
edge-sharing MnO
6 octahedra. Thus, the analysis of the
experimental
PDF data suggests that the nanocrystalline sample is likely to be built
of edge-sharing MnO
6 octahedra. Similar conclusions have
been drawn
[
2] from micro-Raman and Mn K-edge XANES
measurements.
Thus, the search for model structures was narrowed to such showing only
edge-sharing
MnO6 octahedra.
Several
structures are known to occur with crystalline manganese oxides of
chemical
composition similar to that of the nanocrystals we study. We explored
them
in turn starting with the structure type found with crystalline LiMn2O4.
That structure features a three-dimensional network of edge-sharing MnO6
octahedra as shown in Fig.1. As can be seen in Fig.5a, this model reproduces well only the first two
peaks
in the experimental PDF data but completely fails at longer real space
distances.
Obviously, the structure of the nanocrystal is not a 3D network of
edge-shared
MnO6 octahedra. Next a structure type found in Li2MnO3
was attempted. The structure features layers of edge sharing octahedral
units
where two thirds of the octahedral sites are occupied by Mn atoms and
one
third by Li atoms. Mn and Li atoms in the layers are ordered in such a
way
that each MnO6 octahedron shares its edges with three other
MnO6
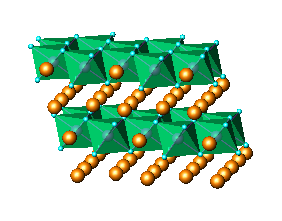
octahedra and three LiO6 octahedra. A fragment of this
structure
is shown in Fig.6a. The model did not perform much
better
as the results in Fig.5b show and was not pursued
further.
A model based on the structure type occuring with LiCoO2 was
considered
as well. This structure type features layers of MO6 (M = Co)
octahedra.
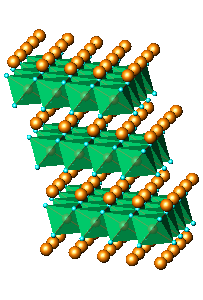
In this model, each MO6 octahedron shares edges with six
other
octahedra of the same type. Fragment of the structure is shown in Fig.6b. The model performed better but still could
not
be refined to reproduce all details in the experimental data as can be
seen
in Fig.5c.
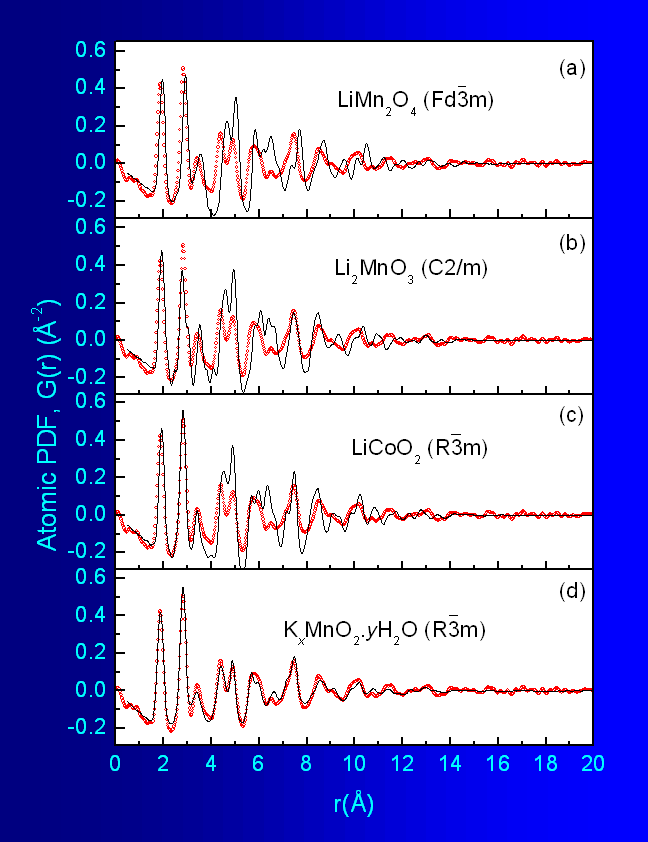
Fig.5 Experimental PDFs for nanocrystalline K-Li-Mn-O-I (dots)
and
calculated PDFs for different structural models. The calculated PDF for
the
KxMnO2.yH2O structure
corresponds
to the refined structural parameters. The rest of the PDFs are
calculated
with published structural data for the respective crystalline materials.
Finally, the structure of the nanocrystalline lithium manganese oxide
was
approached with that occuring in K
xMnO
2·
yH
2O
.
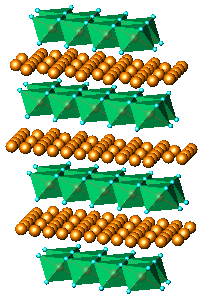
The structure type features layers of MnO
6 octahedra
encapsulating
K atoms and H
2O molecules. A fragment of the structure is
shown
in
Fig.6c. This model was an excellent starting
point
and could be refined to reproduce very well all important details in
the experimental
data as shown in
Fig.5d. The refined structural
parameters
are summarized in
Table 2. The results of the
structure
determination carried out show that, at the atomic scale, the
nanocrystalline
material may be viewed as a stack of layeres made of edge shared MnO
6
octahedra. The layers are well apart (~6.43
Å) allowing
both relatively small Li and much bigger K atoms to occupy the
interlayer
space. This is most likely due to the aqueous preparation route
employed
since it is well known that water makes layered materials swell
facilitating
the encapsulation of bigger-size atomic species. The layers in the
nanocrystal,
however, does not seem to be
arranged in perfect
registry.
As can be seen in
Table 2, the temperature factors
of
Mn and O atoms are highly anysotropic suggesting the presence of a
significant disorder in direction perpendicular to the layers. The
disorder could be
due to the presence of a distribution of interlayer distances centered
at
about 6.43
Å. The structure file and the
macro
file used for the fit of the experimental data are
hyd.stru and
hyd.mac.
Fig.6 Structural
models considered as starting points for the refinement of the
structure
of nanocrystalline KLiMnOI sample: (a)Li2MnO3,
(b) LiCoO2, (c) KxMnO2.yH2O
Table 2. Structural parameters for
nanocrystalline
K-Li-Mn-O-I obtained through PDF analysis. Atomic positions are
refined
in space group R-3m. The structure is given in a
hexagonal
basis.
Method
|
PDFfit
|
| a,
Å |
2.8317(2)
|
| c,
Å |
19.29(2)
|
| z(O)a |
0.382(1)
|
| U11(Mn),
Å2 |
0.0058(1)
|
| U33(Mn),
Å2 |
0.148(1)
|
| Uiso(Li/K/H2O),
Å2 |
0.071(1)
|
| U11(O),
Å2 |
0.0051(1)
|
| U33(O),
Å2 |
0.208(1)
|
| RG,
% |
20.7
|
a The three atoms in the
asymmetric
unit occupy the following Wyckoff positions: Mn 3a (0,0,0); Li/K/H
2O
9d(1/2,0,1/2); O 6c(0,0,z).
In order to further confirm the validity of the results obtained for
the
nanocrystalline sample we calculated the powder diffraction patterns
for
the different trial structural models and compared them with the
experimental
diffraction data (Fig.7). As can be seen in the
figure,
although all models show some resemblance to the experimental data, the
model
that accounts for all observed features of the diffraction pattern is
that
based on KxMnO2·yH2O structure. For
example, this model is the only one that produces a peak at low angles
2θ that mathes
well th eone observed in the experimental pattern. It should be
stressed
out that this is a visual comparison only; for now there are no worked
out
procedures allowing to refine structure model against the broad
diffraction
features shown in Fig.4 .
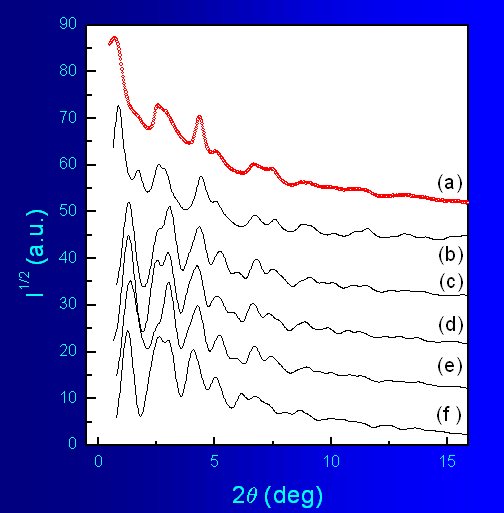
Fig.7 Powder diffraction patterns (λ=0.1065) of
nanocrystalline K-Li-Mn-O-I (a)
and the following model structures: KxMnO2·yH2O (b); rhombohedral
LiCoO2
(c), cubic (spinel) LiMn2O4 (d); monoclinic Li2MnO3
(e); and monoclinic (layered) LiMnO2 (f).
Files used in this example:
- hyd.dat
Experimental diffraction data collected with λ = 0.1078Å
- hyd.rdf
Experimental Atomic Pair Distribution Function
- hyd.stru
Structural file used by PDFFIT
- hyd.mac
Macro file with PDFFIT commands
References:
- Hwang, S.-J.,
Park,
D.-H., Kwon, C.-W.,Campet, G., Choy, J.-H. J. J. Power Sources 2004, 125, 119.
- Hwang, S.-J.;
Kwon,
C.-W.; Portier, J.; Campet, G.; Park, H.-S.; Choy, J. H.; Huong, P. V.;
Yoshimura,
M.; Kakihana, M. J. Phys. Chem. B 2002, 106, 4053.
3. What do I need to start doing PDF analysis?
First of all, powder
diffraction
data of superb statistical quality data are necessary for both the
sample
and background. Also, good real-space resolution should be achieved by
collecting
diffraction data to high wave vectors. This is usually achieved by
employing
high-energy synchrotron radiation (the wave vector is inversely
proportional
to the wavelength) or spallation neutron sources. One may also use a
laboratory
source (MoKα or Ar Ka). With diffraction
data
as input, the program RAD calculates the
corresponding
atomic Pair Distribution Function. In PDF analysis, literature search
is
essential. Due to the limited structural coherence and the lack of such
tools
as extinction conditions, or unit-cell search procedures, the
structural
determination ab initio can be rather difficult. The good news is that
looking
at the diffraction data in direct space, can help very much in
identifying
structural elements like polyhedral coordinations, connectivity, etc.
Another useful knowledge is that nanocrystals usually have structures
similar (if
not the same) to crystalline materials with close chemical composition.
Using
the program PDFFIT, the PDFs for several trial
structures
can be calculated and compared to the experimental one. If the real
structure
(in general terms) is among the tested, the comparison should yield a
structural
model that represents well enough the local atomic ordering in the
material.
In the final step, this structural model is refined against the
experimental
data using the program PDFFIT.
4. Where can I find the necessary programs?
The programs used for data treatment are available as free downloads
from
the web sites of their authors.
- Programs for data correction
and
PDF extraction:
i.
RAD
A program by
V.
Petkov
for analysis of X-ray diffraction data from amorphous materials
ii. PdfGetX
A program by I.-K. Jeong, J. Thompson, A. M. P. Turner and S. J. L. Billinge for
determining
the atomic pair distribution function from x-ray powder diffraction data
iii. PdfGetN
A program by P. F. Peterson, M. Gutmann, Th. Proffen and S. J. L. Billinge for extracting the total scattering structure
function
and the pair distribution function from neutron powder diffraction data
- Programs for structural refinement using Pair
Distribution Functions:
i. PDFFIT
A program for full profile structural refinement of the atomic pair
distribution
function. Authors: Th. Proffen and S. J. L. Billinge
5. Is there more information on PDF analysis available?
There is a number of books and research publications discussing
different
aspects of the structural determination from Pair Distribution
Functions.
Here is a short list:
i.
Underneath the Bragg Peaks :
Structural
Analysis of Complex Materials by T. Egami and S. Billinge,
Elsevier
Science, 2003. Buy
at Amazon.com
ii.
Local Structure from Diffraction
by
S.J.L Billinge and M.F.Thorpe (editors), Plenum, 1998. Buy
at Amazon.com
iii.
From Semiconductors to Proteins:
Beyond
the Average Structure by S.J.L. Billinge and M.F. Thorpe
(editors),
Plenum, 2002. Buy
at Amazon.com
i.
Th. Proffen, S. J. L. Billinge, T. Egami and D. Louca, Structural analysis of complex materials
using
the atomic pair distribution function - a practical guide, Z. Kristallogr. 218,
132-143
(2003).
i.
V. Petkov,
M. Gateshki, J Choi, E.D. Gillian and Y. Ren, " Structure of
nanocrystalline GaN from X-ray diffraction, Rietveld and atomic pair
distribution function analyses", J. Mater. Chem. 15 (2005),
4654 .
ii. V. Petkov, Y. Peng, G.
Williams, B.
Huang, D. Tomalia and Y. Ren, “Three-dimensional
structure of gold
nanoparticles in water by x-ray diffraction and computer
simulations”, Phys.
Rev. B 72 (2005) 195402.
iii. M. Gateshki, V. Petkov, S.
K. Pradhan and T. Vogt,
“Structure of Nanocrystalline MgFe2O4
From X-ray Diffraction, Rietveld and Atomic Pair Distribution
Function
Analysis”, J. Appl. Cryst. 38 (2005) 772.
iv. V. Petkov, P. Y.
Zavalij, S. Lutta, M. S. Whittingham, V. Parvanov and S. Shastri,
Structure beyond Bragg:
Study
of V2O5 nanotubes, Phys. Rev. B 69
(2004)
085410.
v.
V.Petkov and T .Vogt, Positional
disorder
of Ba in the thermoelectric germanium clathrate Ba6Ge25,
Solid State Comm. 127 (2003) 43.
vi. V. Petkov , S.J.L. Billinge, T .Vogt, A.S. Ichimura and J.L.
Dye, Structure of intercalated Cs in
zeolite ITQ-4:
an array of metal ions and correlated electrons confined in a
pseudo-1D
nanoporous host, Phys. Rev. Lett. 89 (2002) 075502.
vii.
V. Petkov, E. Bozin, S.J.L. Billinge, T. Vogt, P. Trikalitis and M.
Kanatzidis,
Structure of nanocrystalline V2O5.nH2O
xerogel
determined by the atomic pair distribution function technique, J.
Am. Chem. Soc. 124 (2002) 10157.
viii.
V. Petkov, S.J.L. Billinge, S.D. Shastri and B. Himmel, High-resolution atomic distribution
functions
of disordered materials by high energy x-ray diffraction, J.
Non-Cryst.
Sol. 293/295 (2001) 726.
ix.
Jeong IK, Heffner RH, Graf MJ, Billinge SJL, Lattice dynamics and
correlated
atomic motion from the atomic pair distribution function, Phys. Rev. B, 67 (10): Art. No.
104301.
x.
Proffen T, Petkov V, Billinge SJL, Vogt T, Chemical short range order obtained from
the
atomic pair distribution function, Z. Kristallogr. 217
(2):
47-50 2002
i. X-Ray Diffraction
Procedures:
For Polycrystalline and Amorphous Materials by H. P. Klug, L. E.
Alexander,
Wiley-Interscience, 1974, Buy
at Amazon.com
ii. The Structure of Non-Crystalline Materials
by Y. Waseda, McGraw-Hill, New York, 1980.
iii. Characterization
of Nanophase Materials by Zhong Lin Wang, Vch Verlagsgesellschaft
Mbh,
2002 Buy
at Amazon.com
iv. X-Ray
Diffraction : In
Crystals, Imperfect Crystals, and Amorphous Bodies by A. Guinier,
Dover,
1994, Buy
at Amazon.com
